How to read a forest plot in a nutrition meta-analysis: for dietitians

Keenoa
blog Keenoa
Almost every week, there is a new attention grabbing nutrition-related headline all over social media. Whether it’s a new immune-boosting “superfood” supplement or an ordinary ingredient which now “astronomically increases our risk in developing disease”, misinformation about food and nutrition is becoming as mainstream as eating three meals a day.
The caveat is that these claims often stem from seemingly credible-sources: scientific studies published in peer-reviewed journals. But, more often than not the findings of studies become overhyped, leading to low-evidence conclusions purported as a definite cure or absolute truth.
As dietitians trained in evidence-based nutrition, we know the findings of one study (even of excellent quality) is only one part of the puzzle. We are capable in appraising the evidence and selecting interventions which are based on carefully reviewed literature. However, there is one part of scientific studies where some of us may fall short in truly understanding - the statistical analysis.
In understanding the basics behind common statistical analyses used in nutrition studies, we can better interpret the quantitative data which we are presented with. Whether we want to incorporate findings into clinical practice or help combat misinformation on social media, quantitative analysis skills are always extremely useful as a dietitian!
How are statistics portrayed in meta-analysis?
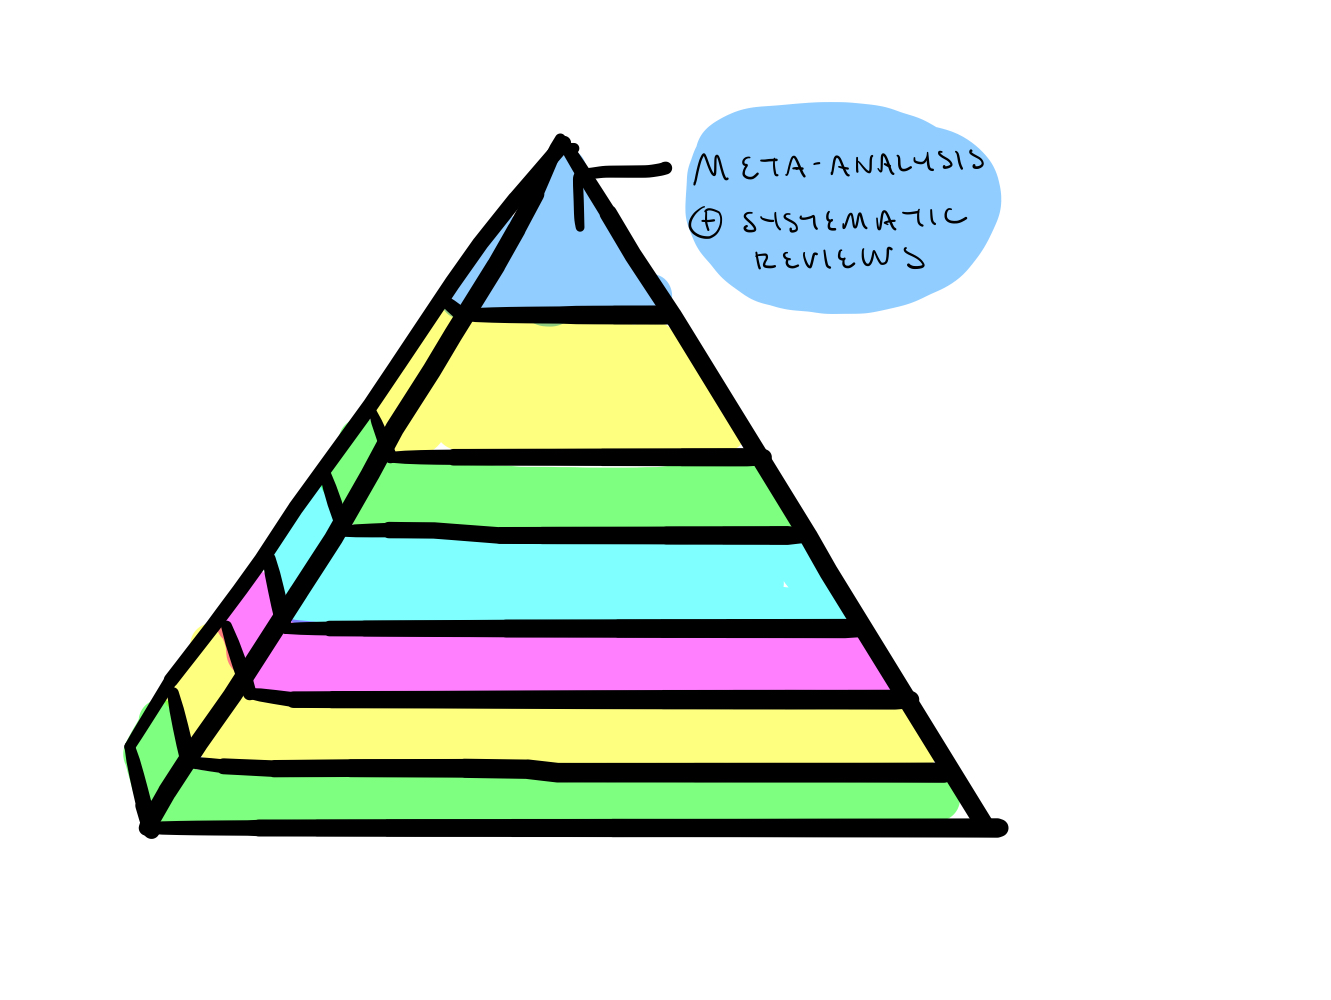
One place where statistics is of particular interest is in nutrition meta-analysis. In terms of hierarchy of evidence, meta-analysis and systematic reviews are often considered as the strongest level of evidence.
In a meta-analysis, conclusions are drawn by analysing the pooled data from multiple studies. The data is portrayed in a forest plot.
A forest plot can help us visualize and summarize the overall picture of the current level of evidence based on the studies analyzed.
What do the axes mean in a forest plot?
Let's pretend that we are looking at the forest plot of a hypothetical meta-analysis which examined several randomized controlled trials (RCTs) looking at the effect of oral vitamin C supplements on blood pressure levels. The purpose of RCTs is to compare a specific treatment to a placebo/control.
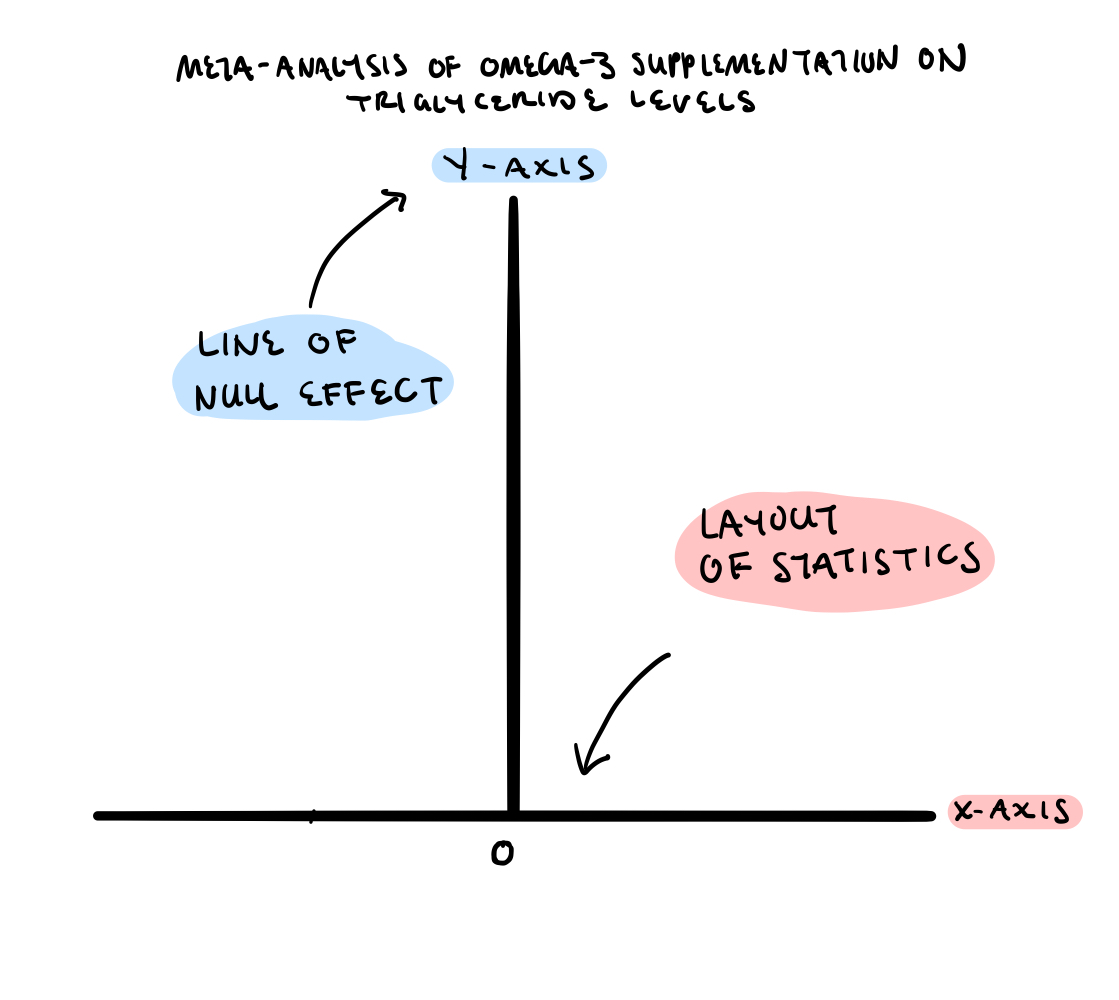
When we take a look at the forest plot, it is like any other graph where we always start with the X and Y axes.
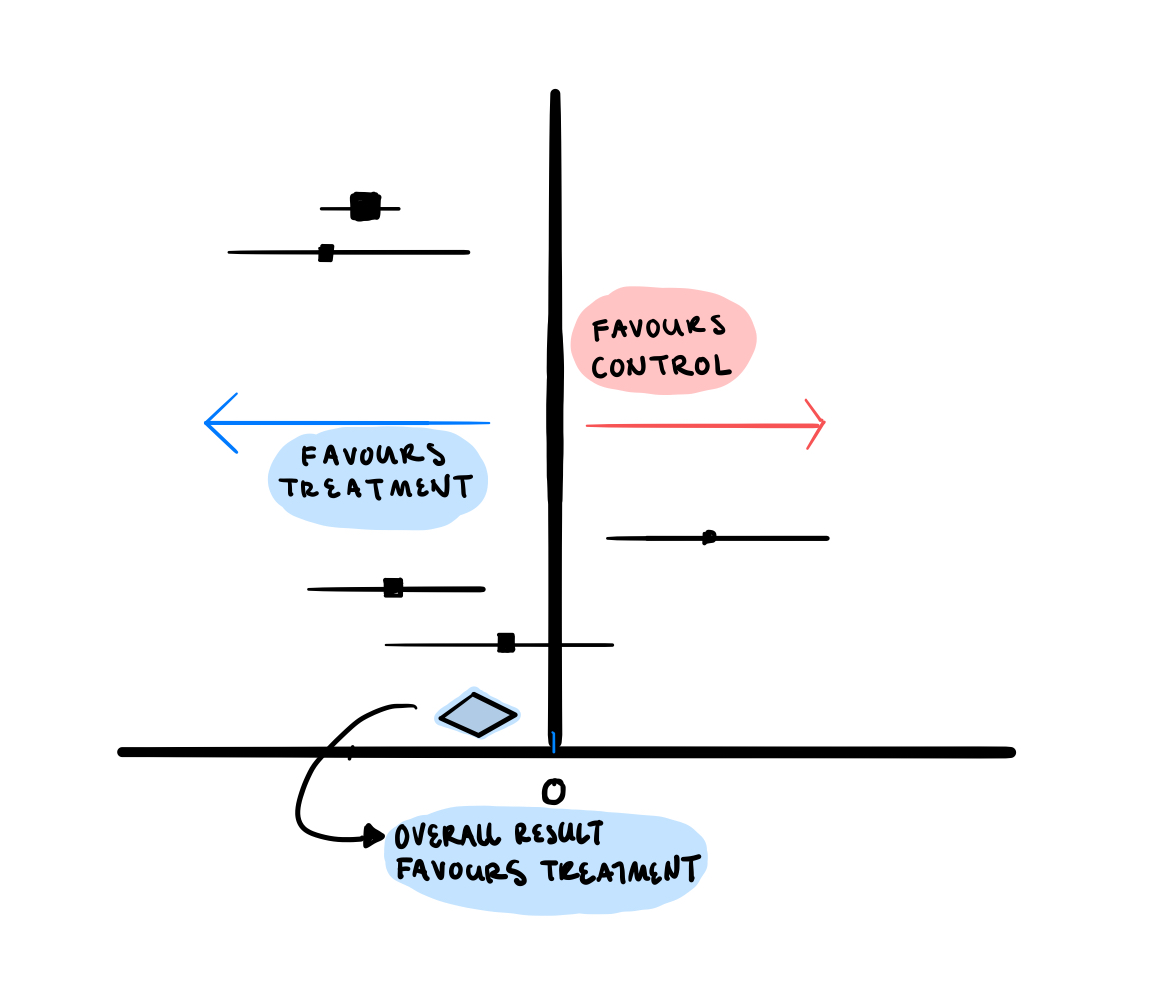
The Y axis is the line of null effect, this line sets the bound where there is no effect between the treatment and the predicted outcomes.
The X axis depicts the types of statistics used, here these statistics will dictate what the scale of the effect is.
In meta-analyses of RCTs, absolute statistics are used, such as a standard mean difference which means the line of null effect sits at 0. This means that no difference is observed in the outcome (blood pressure) between the treatment (vitamin C) and the control (placebo)
*Note: Meta-analysis most often analyzes the data from either randomized-control trials or observational studies. For the sake of simplicity, this article will focus on how to read a forest-plot based on the typical statistics found in meta-analysis of randomized controlled trials. *
How are the statistics of each individual study shown in a forest plot?
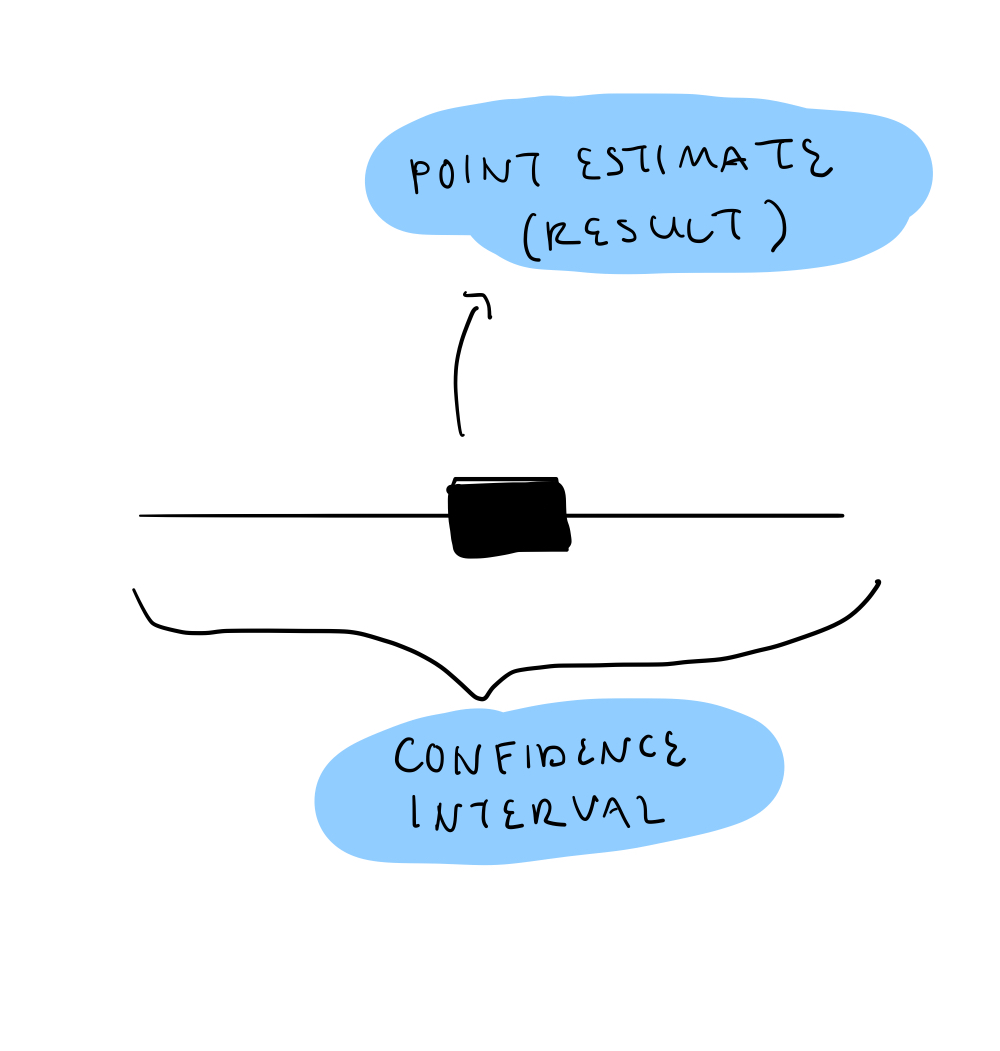
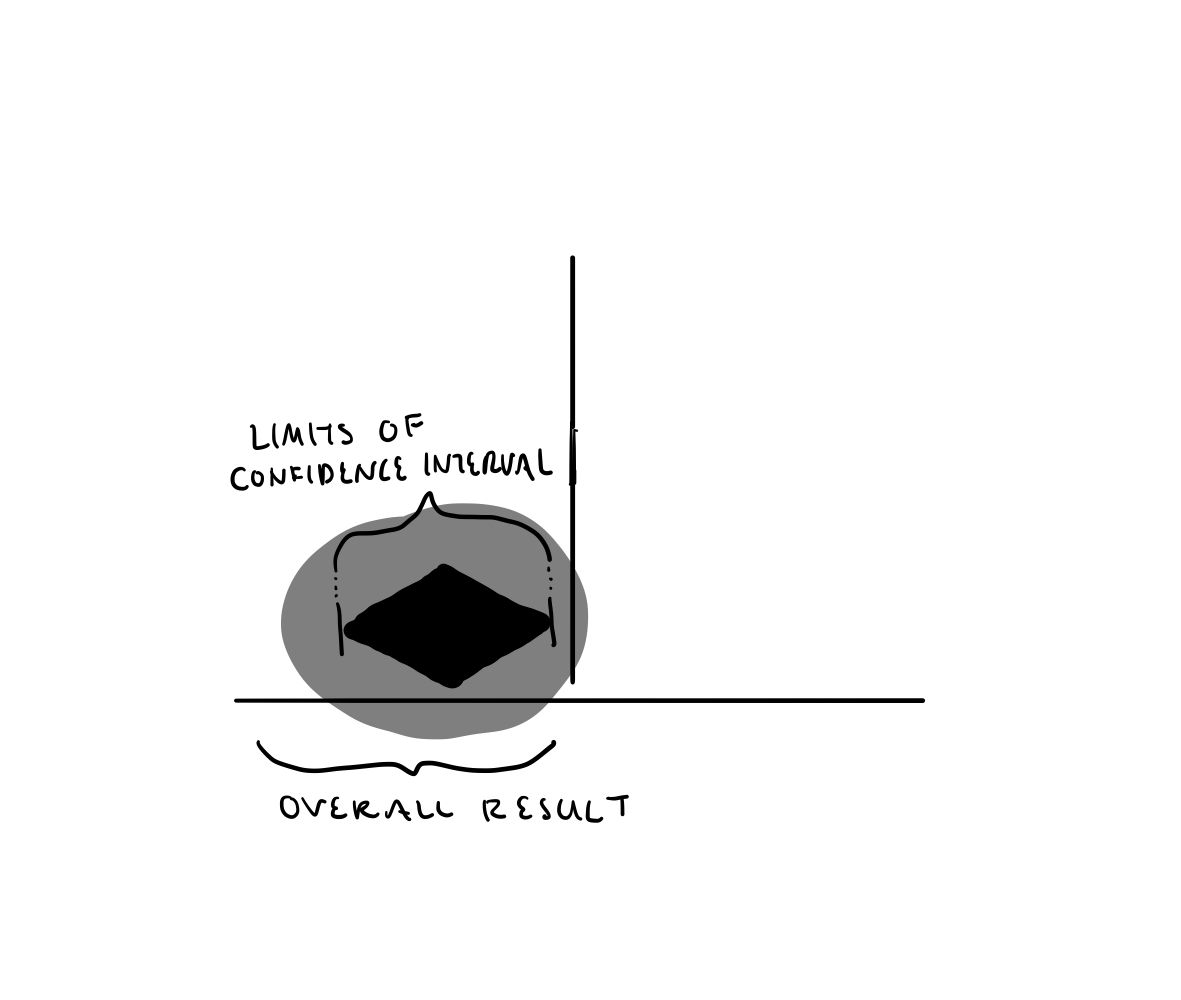
Now that we have our axes, we need to add studies analyzed onto the plot. In a meta-analysis, each study analyzed will be plotted based on their point-estimate and confidence interval.
This point-estimate is ultimately the result of the study which comes from the absolute statistics used in RCTs. The point-effect is represented by a black-box which varies in size. Typically, the larger the sample size of the study, the larger the black-box will be.
The confidence interval is the range in which we are 95% sure that our result (point-estimate) falls within. If the confidence interval passes the line of null-effect, the result from that study is deemed statistically insignificant.
Let's go back to our hypothetical meta-analysis of RCTs of the effect of vitamin C on blood pressure levels. For simplicity, we will only include two studies on the forest plot.
Thanks to the larger sample size in study A (see the illustration below), this study had a smaller confidence interval which did not cross the line of null-effect. This means that their findings of vitamin C supplements decreasing blood pressure compared to control was statistically significant.
On the other hand in study B, this study had smaller sample size which resulted in a larger confidence interval which crossed the line of null-effect. Therefore, the vitamin C supplement was not statistically significant in decreasing blood pressure compared to control.
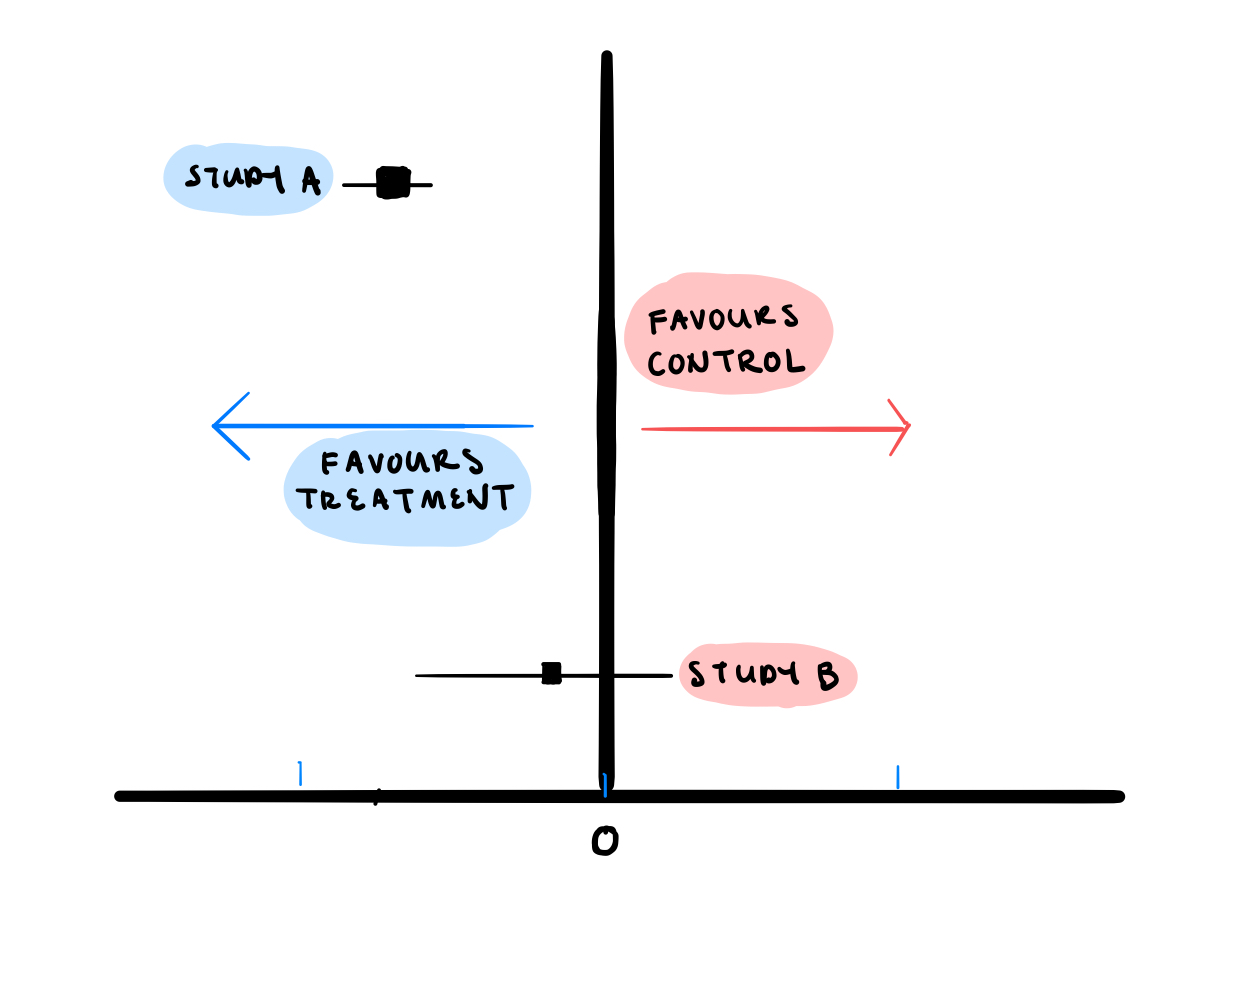
__The bottom line: __Stronger study designs, such as those with larger sample sizes result in a smaller confidence interval which is less likely to cross the line of null effect and become statistically insignificant.
How does the forest plot show us the overall result of the studies analyzed?
The overall result is shown by a diamond at the bottom of the forest plot. Similar to the individual studies, the larger the confidence interval (the more the diamond is “stretched out”) the less precise the results of all the studies and is therefore more likely to cross the line of null effect. On the other hand, if the effect size is large and the confidence interval is smaller, it will be less likely to cross the line of null-effect.
Now, let’s put it all together
Let’s add a few more hypothetical studies to our meta-analysis examining the effect of oral vitamin C supplementation on blood pressure levels. Here, we can see that the confidence interval of the diamond does not cross the line of null effect. This means that the overall conclusion of this meta-analysis suggests that vitamin C supplementation decreases blood pressure levels and favors treatment.
(P.S while this is a hypothetical example, there is a meta-analysis which found oral vitamin C supplements to reduce systlolic blood pressure, if you are interested!)
How do we analyze the overall strength of the meta-analysis?
Despite that meta-analysis and systematic reviews are considered as high quality evidence, researchers will only get out what they put in. In other words, if poor quality studies are selected, the resulting meta-analysis may not be the best source of evidence.
Similar to appraising other scientific articles, it is helpful to critically assess each piece of evidence by asking the following questions:
- Are the articles included in this meta-analysis of high-quality?
- Was there selection bias in the articles included?
- Were proper reporting methods followed, such as PRISMA?
- What are the sources of bias or conflicts of interest in this study?
The next time you are dissecting a nutritional meta-analysis, we hope these tips help you critically analyze think the results. Ultimately, by better understanding the basics behind statistical analysis, us dietitians and dietetic students can leverage this knowledge to help better make evidence-based informed decisions!
About
References

A nutritional intervention just as effective as medication
We sat down with Registered Dietitian Krystel Dubé from Équipe Nutrition, one of the largest groups of dietitians…

Anne-Julie Tessier, RD, PhD
Co-Founder Keenoa

How COVID-19 is affecting the eating habits of Canadians
On March 11th, 2020, the World Health Organization declared COVID-19 as a pandemic. In Canada, amongst other…

Kristen Sunstrum
Dietetics Practice Development Advisor - Keenoa

Calcium supplements: friend or foe?
Calcium and bone integrity Calcium is an abundant mineral in the body that plays a pivotal role in bone…

Angel Ong, RD, MSc
Registered dietitian, MSc, PhD candidate McGill University